
GamerVapor, Part 1: Predicting Who Leaves the Steam Community
01 Aug 2019Written in September 2026, looking back; dated to when the project was built.
In the summer of 2019 I left particle physics for industry through the Insight Data Science fellowship. Insight fellows spend four intense weeks building a data product from scratch and then present it to hiring companies. Mine was GamerVapor, a tool to predict and diagnose churn in the Steam community.
This is a look back at that project, seven years later. Part 1 covers the idea and what I found. Part 2 covers the data engineering (how I collected a 200,000-user social network from a public API), and Part 3 covers the modeling.
Why Steam?
In 2019, about 65% of American adults played video games, and Steam, Valve’s PC gaming platform, held roughly three quarters of the PC digital distribution market. But Steam is more than a store. It’s also a social network: every user has a profile, achievements, groups and a friends list.
That community matters to the business. People who are engaged with friends on the platform keep coming back, and people who come back buy games. So a question a community manager might ask is: which users are about to drift away, and what would keep them?
Defining churn
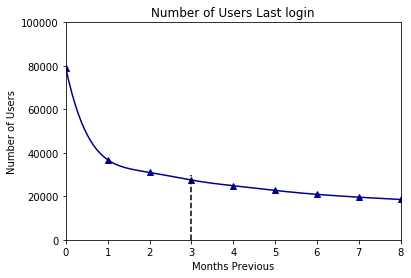 How many users had been away for at least N months. The curve flattens after about three months.
I defined a churned user as someone who hadn’t been on Steam for more than 3 months (using the “last log-off” time Steam reports for every user). The curve above is why: the number of users who had been away drops steeply over the first few months and then flattens out. Someone gone for three months is usually gone for good.
By that definition, about 15% of the users I studied had churned.
What GamerVapor did
GamerVapor was built for community managers and marketers, and it did three things:
- Identify users likely to churn. Score every user by their probability of leaving the platform in the next three months.
- Recommend targeted actions. For a given user, predict how much each possible nudge (a new friend, a new game, a profile update) would change that probability.
- Score communities. Give each friend group a community health score, based on how at risk its members are.
The web app took a Steam ID and returned all three:
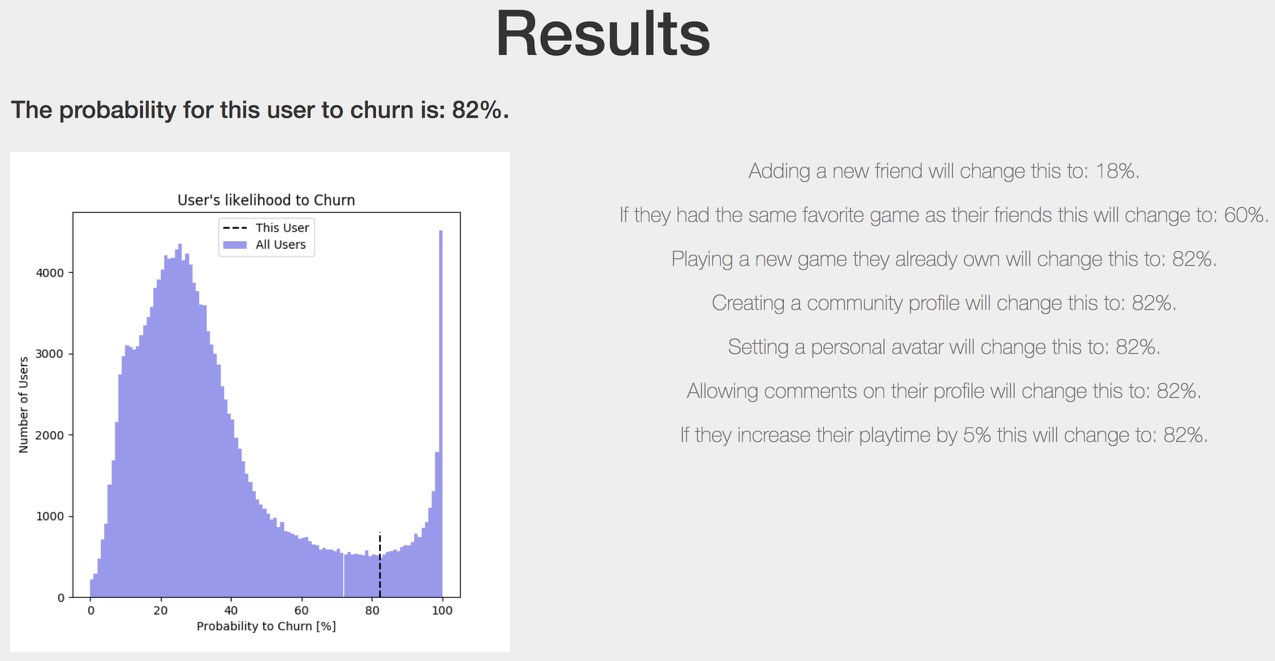 Results for one user: an 82% chance of churning, and the predicted effect of each action. Adding one new friend would drop it to 19%. Nothing else moved it by more than a couple of points.
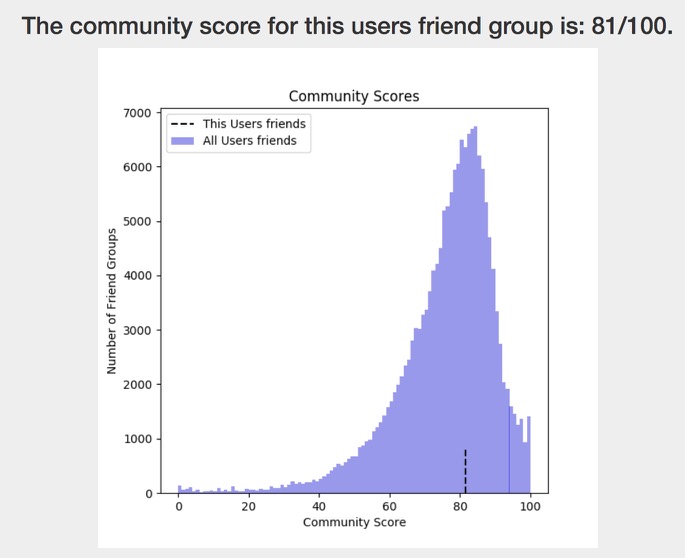 The community score for the same user’s friend group.
The finding: Steam is about friends
The most interesting result wasn’t the model itself. It was what the model said about how people use Steam. I ran the same “what if?” on every user in the data, and three stories emerged:
- People don’t use Steam to play games alone. If every user played 5% more, churn barely changed.
- People use Steam to play games with friends. Sharing a favorite game with your friends lowered churn.
- People use Steam to make new friends. Adding a single new friend moved most at-risk users from “likely to leave” to “likely to stay”.
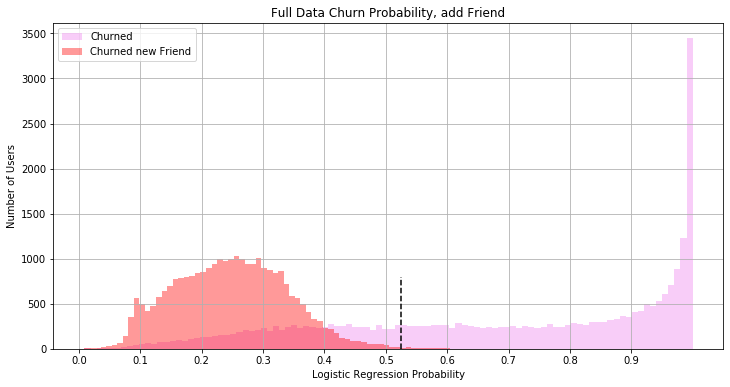 Churned users’ predicted churn probability, before (pink) and after simulating one new friend (red). The dashed line is the churn threshold.
The single strongest feature in the model was how recently a user made a new friend. That makes GamerVapor’s advice simple: if you want to keep someone on the platform, help them connect with people.
The 2019 toolkit
This was a 2019 project, built with 2019 tools, in four weeks, by one person:
- Python, requests and pandas to call the Steam Web API and store the results as CSV files
- Jupyter notebooks for exploration, feature engineering and modeling
- scikit-learn for logistic regression, scaling and validation
- PostgreSQL to hold every user’s precomputed scores for the app
- Flask (with Bootstrap and matplotlib) for the web app, hosted on Heroku
No cloud ML platform and no deep learning. A clean, interpretable model was the right tool, because the point was to explain why users churn, not just to flag them.
The code is on GitHub: the data collection and analysis and the web app.
Next, Part 2: building the dataset.