
GamerVapor, Part 3: Modeling Churn (the Data Science)
01 Aug 2019Written in September 2026, looking back; dated to when the project was built.
Part 2 turned a crawl of the Steam friend graph into 17 features for about 200,000 users. This post covers the model: how I trained it, how I checked it, and what it said about why people leave.
Why logistic regression
GamerVapor had two jobs: flag users likely to churn, and explain what would change that. The second job ruled out a black box. Logistic regression gives every feature a coefficient you can read, and it makes “what if this user had one more friend?” a simple calculation. In 2019, for a few-week project, it was also fast to train, easy to regularize and easy to validate.
Dealing with class imbalance
Only about 15% of users had churned. Trained on the raw data, a model can score well by mostly predicting “active”. So I:
- Held out 20% of users as a test set, then down-sampled the active users in the training set, so the model saw equal numbers of churned and active users.
- Kept the true 15% ratio in the holdout test set, so the evaluation reflected what the tool would face in the real world.
- Standardized the features (scikit-learn’s
StandardScaler) and used L2 regularization, with the strength (C = 0.1) chosen by validation. - Tuned the decision threshold. A user was flagged as churning when the predicted probability was above 52.5%.
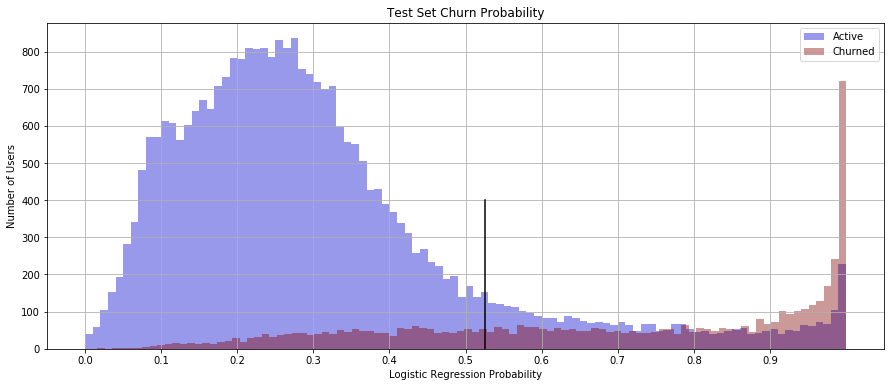 Predicted churn probability on the test set: active users (blue) and churned users (purple), with the threshold marked.
How well it worked
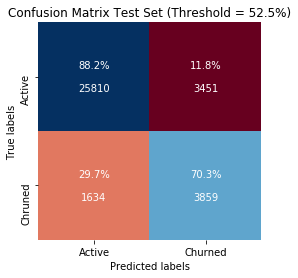
On the holdout set, at the true population ratio:
- Recall: 70%. It caught 3,859 of the 5,493 users who churned.
- Precision: 53%. Of the 7,310 users it flagged, just over half actually churned.
- 88% of active users were correctly left alone.
For a retention tool, that trade-off is reasonable. A flagged user who wasn’t actually leaving gets a friendly nudge they didn’t need, which is cheap. Missing someone who’s about to leave costs more.
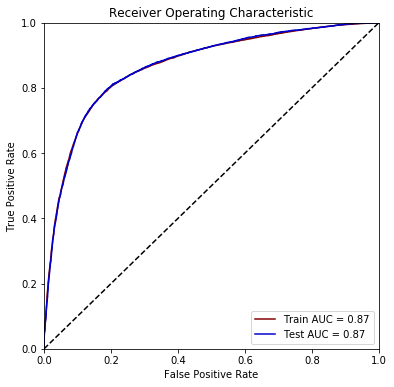
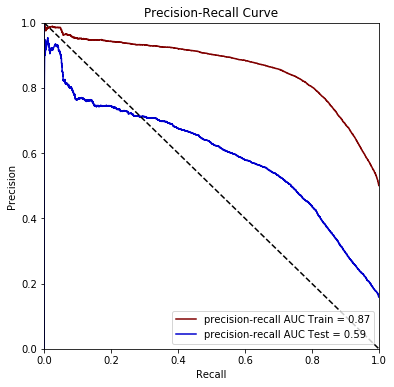
The two curves tell a useful story together. The ROC curve is identical on train and test (AUC 0.87), so the model isn’t overfitting. The precision-recall area drops from 0.87 to 0.59, but that’s not overfitting either: precision depends on how common the positive class is. The training set was 50% churners and the test set was 15%, so the same model has a harder time being precise on the test set. It’s a good reminder to report precision-recall on data with the real base rate.
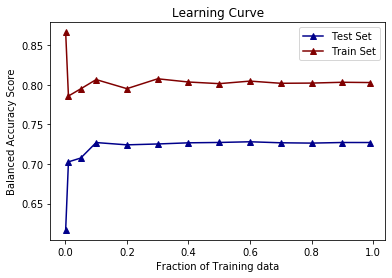 Learning curve: performance levels off after about 10% of the training data.
The learning curve flattens early. More users wouldn’t have helped much; better features would.
What drives churn
The model’s most important features, by coefficient size:
| Feature | Importance |
|---|---|
| Time since newest friend | 2.29 |
| Time since oldest friend | 0.31 |
| Shares a favorite game with friends | 0.28 |
| Number of friends “up” the crawl tree | 0.19 |
| Account creation time | 0.17 |
| Friends’ average number of friends (down the tree) | 0.16 |
| Has a custom avatar | 0.08 |
| … playtime, games owned, privacy settings | ≤ 0.04 each |
One feature dominates: how recently a user made a new friend. Social features fill most of the rest of the list. Playtime, the thing you might expect to matter most for a gaming platform, barely registers.
Turning the model into advice
Because the model is linear, “what would keep this user?” can be answered by changing one feature and re-scoring. GamerVapor did this for every candidate action, for every user:
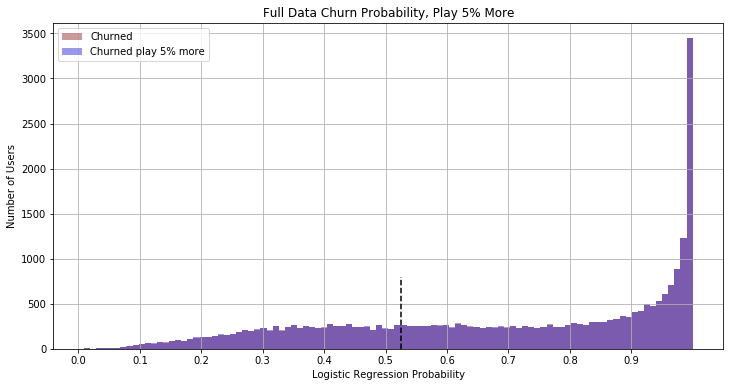
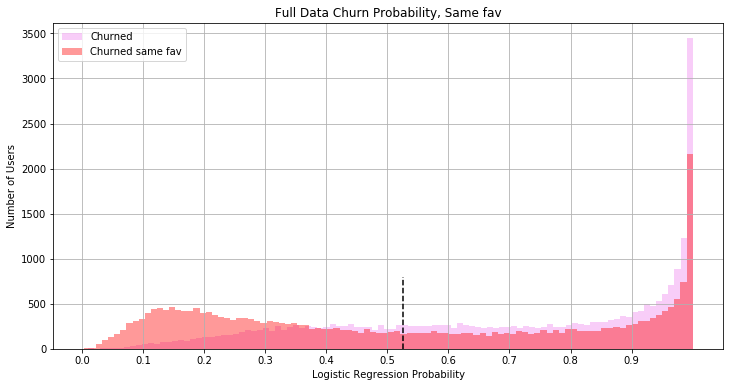
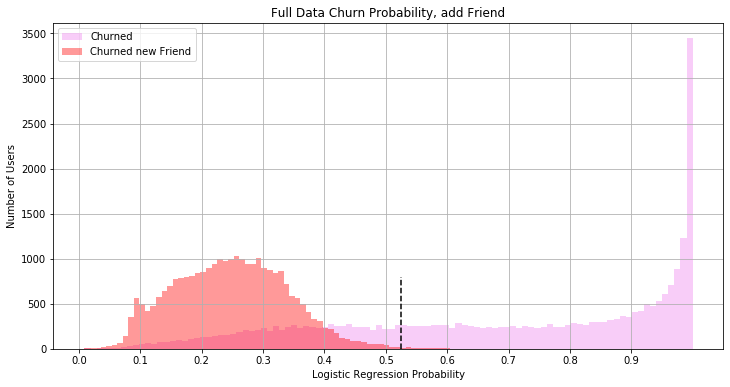 Add one new friend: most churned users move below the threshold.
The same idea powered the community score: 100 × (1 − the average churn probability of a user’s friends). A friend group where nobody is likely to leave scores near 100.
In the web app, none of this was computed live. Every user’s probability, community score and “what if” results were precomputed in a notebook and stored in PostgreSQL, so the Heroku app only had to look them up.
Looking back from 2026
I’m still fond of this project, but with seven more years of experience, a few things jump out.
The top feature is partly a symptom. Someone who stopped logging in months ago also stopped adding friends months ago. So “time since newest friend” partly measures the outcome itself. The fix is the one from Part 2: build features only from data before the churn window, and predict forward in time.
“What if” isn’t “because of”. Re-scoring with an extra friend shows what the model associates with staying, not what would cause someone to stay. People who make friends may simply be the kind of people who stay. The recommendations were hypotheses worth testing, ideally with an experiment, not proven levers.
The answer might still be right. Even with those caveats, the direction held up across every view of the data: Steam is a social platform, and social connection is what keeps people on it. For a few weeks of work in 2019, finding that clearly, and being able to explain it, was the point.
The notebooks behind this post are on GitHub (the final model is Logistic_Regression_Profile_Info_Clean_v3.ipynb), and the web app is here.
That’s the end of the series. Thanks for reading!