
FitBit Days, Part 1: Neural Network to Classify Days.
02 Apr 2019In my last post, I made a NN with TensorFlow to predict the goals a player will score in a future season based on data from FBref.com. I cannot say it was very successful, but it’s now time to change gears!
I got some feedback that this blog has been too technical, and not enough time has been spent on the bigger picture. Let’s try to remedy this! Today I want to discuss a classification I have done using my personal FitBit data.
No code, no learning curves, let’s just discuss the problem, how I think it could be useful, and how you (Yes, you!) can analyze your own data.
FitBit data and problem formulation
The goal is to use my personal data to classify ‘office days’ vs ‘recreation days’. Everyone has a different activity level, and the goal was to build a model to categorize the days in and out of the office. If my phone application can learn different categories of the days I have, it can better recommend actions for me to be healthier.
Why?
Often I find myself working weekends, when I should be recharging my mental batteries. Can my FitBit tell me when that is happening?
Let’s take an example: How should my tracker respond if I am at the office working on a cool TensorFlow project even though it is a weekend? If my tracker can identify this, later in the month it can recommend me to be more active because I did not have my normal activity levels earlier in the month. For someone like me, (who can be a bit obsessive about a project), that would be extremely helpful.
Currently, the app uses ‘active minutes’ to set goals for active days per week, and individual goals can be set for each different category the tracker monitors on a daily, weekly, and monthly basis. This is great and completely customizable through the FitBit App/Webpage.
But, can the app use the concert of all that information it classify days so a user can monitor ‘office days’ vs ‘recreation days’? As a proxy for ‘office days’ I will look at data from weekdays, the fraction of holidays should be small in this sample. As a proxy for ‘recreation days’ I will use weekends, my personal weekend activity will vary greatly but I hope it will be distinct.
Who?
You! I included a python script for anyone to download here. If you have downloaded your personal data it can be used to train the model on your data, and then produce a set of classifications for you to see if recent months have been a good or poor balance in your life!
How to get your data
Really easy! Here is a link with the instructions:
Intuition
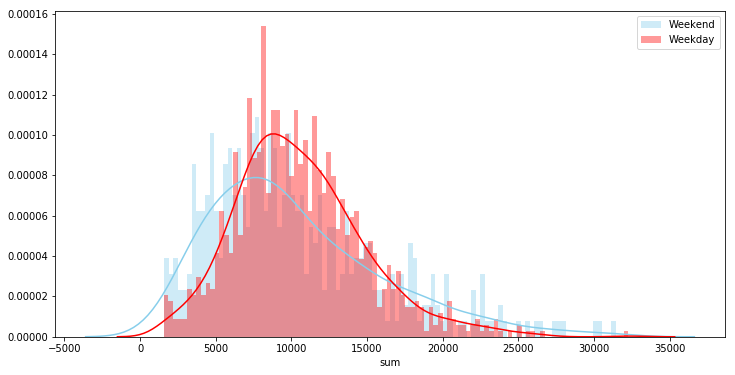
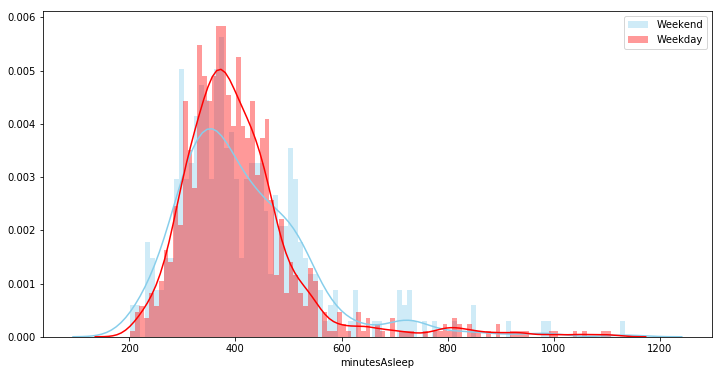
My intuition was that my weekend days would have more total steps on average as I run errands. However, my office days would be more consistent because weekend activities vary greatly. I also think I sleep longer on weekends than on weekdays. Those weekend days may have also higher fraction of time in sedentary state, while I relax and do some mental reset.
This is completely anecdotal, but can it be confirmed with actual data?
Result!
Below I go into the details of what is actually done, but for those who are just wondering what the result is…
Voila! A Tableau dash board with my predictions compared to the actual weekend days! My classifier has an accuracy of 73%(±3%) (and an F1-score of 73% as well). For sure it could be improved, (discussed below) but as a first pass this is very interesting. It looks like I need to spend more time outside the office!
Below, I will present some technical details but try to offer more general interpretations.
Explore the data
After downloading the data I did some basic data exploration. My data contained information starting on 2014-08-29 through 2019-03-26. There were some missing days (and months… those bands break so easy!) but overall a great dataset with more than 1200 days, after cleaning. Unlike my last project, I am sure that I have enough data. Most is organized by date, but some is as granular as minute by minute.
I found that the variables I wanted to look into the most were:
-
Total Steps in a day: FitBit keeps its records in GMT, so this is the sum of steps per day in GMT. I could have tried to convert this to local times but that gets tricky. I lived in Europe and the US during this timeframe, so it gets a bit difficult (even before considering Daylight Savings). I also cut away days without at least 1500 steps.
-
Minutes Asleep: I chose to keep only two sleep variables, minutes asleep is the time in minutes that the tracker recorded I was sleeping. ‘Time in bed’ and ‘sleep duration’ were almost completely correlated with sleeping minutes so I chose to use one variable and drop the others. I also dropped days where the logged minutes asleep were less than 200 minutes.
-
Minutes Awake: This is the second sleep variable. This clearly does not contain as much information as the two above, but is a measure of the minutes ‘tossing and turning’. Interesting and easy to include.
-
Sedentary, lightly active, moderately active, and very active minutes: The next group of variables are derived from the heart-rate data that the tracker collects. The FitBit webpage actually describes these really well here.
To create the target variable for training and validation, I converted the date string with each measurement into a boolean True or False for weekends.
Prepare the data
Similar to the last project, I decided to use the QuantileTransformer for scaling and normalization. I also tried StandardScaler, and saw similar performance. I did run my NN model on the dataset before standardization and got an accuracy of about 50%.
For analysis of the learning curves and F1-scores, I did a train/test split of 80/20%. While for the K-Fold validation, I used the mean of the accuracy to measure performance.
Train the Neural Net
All of this discussion can be seen in the jupyter notebooks included in the GitHub repository. I did not do a full tuning of all hyperperameters, the full grid search option seemed a bit of an overkill for this small project.
I followed this great post which gives some great pointers for finding the basic structure of a binary classifier. I made a few basic structures, and made some learning curves with the early stop and history plotting modified from a TensorFlow tutorial.
All four models, seemed to have similar performance (F1-scores) and learning times, so I moved on to K-Fold validation to make sure I was not duped by my train/test split. Again all four models had similar performance, so I picked the simplest NN structure (1 dense hidden layer with seen nodes).
For you to use!
After all of this analysis, I thought it would be interesting to put this all into a script that any user can download and use! So I did here.
The input will take the directory location of your FitBit JSONs, and output a CSV with the variables used for classification, the target classification, and the predicted classification.
Tableau viz and Interpretations
The dashboard I made to view the output is shown above. However, you can download the workbook here. For my personal information, the difference between my predicted classification and the actual number of ‘rest days’ seems to be consistently low by 2 days a month. I choose to interpret this as evidence that I work too many weekends. Though I cannot say that this is guaranteed.
This could be a bias in my activity. For example, it could be that the weekday data sample has a significant number of recovery days included, biasing my ability to separate the two datasets. We know that holidays, sick days, etc. are lumped as one example. Additionally, I know that many weekends were spent working, again producing data points which make it difficult to distinguish the two days using my data.
Next steps
My standard list of three ways that someone could make what I show here better:
-
Grid Search the NN space. I did not do a formal grid search of the hyperparameters but that would be a great next step to make the classification a little better.
-
Make a monthly analyzer, based on the classification make small script that outputs “X number of weekend days remaining” this month. The Tableau viz is nice, but not sure it actually provides something actionable yet.
-
Interface this with the FitBit API, to download and update model automatically and iteratively.
There are many other things, but those are the three that I wanted to do. The reality is that I think with this simple model I have done extremely well with this dataset.
Questions
-
Have I missed something fundamental in my formulation of the problem? (This will probably appear on most posts, I really wonder where I could do better!)
-
Is this applicable to other user’s datasets? Any friends out there willing to let me play with their FitBit data? I want to know if this is too specific to me!
-
Can this technique be generalized? E.g. athletes on a training schedule. Can this be used to tell them that they need more rest/recovery days? What about people with more active hobbies (e.g. hiking) than myself? I imagine it would do even better classification in those cases!