
EPL History, Part 1: Scraping FBref.
18 Feb 2019This is the first part in a series where I will analyze data on the English Premier League. I will look at league data from the ‘92-‘93 season until the ‘17-‘18 season exclusive to the league matches, ignoring other cups and tournaments. In this post I will describe the dataset and the methods used to collect it.
Motivation
To everyone’s surprise, I am a regular reader of fivethirtyeight.com (a murmur of gasps ripples through the readership as the old ladies clutch their pearls). Neil Paine wrote a great piece on why Football statistics are so difficult back in 2014. The take home message of that article is that football statistics are really in their infancy compared to most other sports. There are good tools available now to predict club matches, but developing an all-in-one measure for individual players, similar to those for MLB or NBA, remains elusive.
However, recently Sports Reference launched FBref.com, containing a great collection of statistics on all the major Football leagues. Anyone familiar with advanced sports statistics and blogs will tell you that SR has been an invaluable collection of resources to the community for years. I am hoping that this new resource will be the same for Football statistics.
Is that your goal? To develop a revolutionizing player performance metric for the most popular sport in the world?
No no, I am new to Football statistics and honestly there are companies which compile a lot more information (see whoscored.com). But I would like to understand what insight this new dataset can give us.
Why FBref.com and not whoscored.com?
FBref.com is a new resource, launched in June of 2018. Let’s see what we can get form this new dataset!
Second, whoscored.com is particularly difficult to scrape. Whoscored is a company selling their analytical insights for profit and have built their webpage in a way that is intended for their information to keep its value. However, I think it can be done. I started looking into it here but it requires using packages like selenium and timing automated browser clicks I found a bit tedious.
Scraping the EPL data
Let us look at the FBref_EPL package I built to collect the data.
Blindly executing
There are two scripts, one for keeper stats and another for player stats.
Blindly running them is easy: FBref_scrape.py -f <url_csv_file>.
This should work for any league FBref collects statistics on. All you need is a csv list of urls to the season stats pages.
The content of my python code is based on great examples here and here.
Packages needed
The list of packages needed to read this data in python is not extensive:
    import requests
    from bs4 import BeautifulSoup
    import pandas as pd
    import re
    import sys, getopt
    import csv
All are very are common:
csv,sys,getoptfor input and parsing the input file.re,requestsfor fetching and compiling the htmlBeautifulSoupfor parsing the htmlpandasfor saving the dataset
Code description
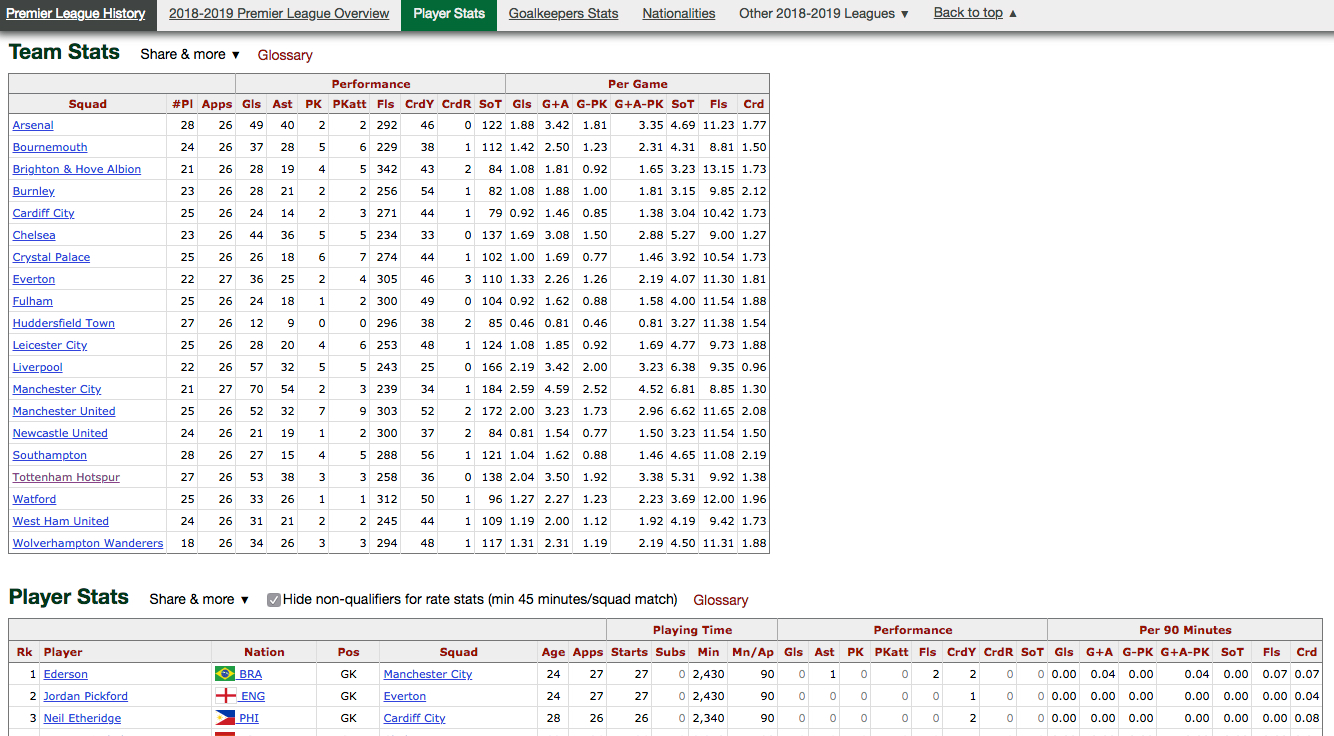
The FBRef page for a given season’s statistics contains two tables. One table contains the team level statistics and another with the player level. Seen here:
The first step is to access the html which displays these tables in a web browser through python. These lines of code access the url for that season, get around some trickery inside the html block, and save the html into a BeautifulSoup:
    res = requests.get(url)
    ## The next two lines get around the issue with comments breaking the parsing.
    comm = re.compile("<!--|-->")
    soup = BeautifulSoup(comm.sub("",res.text),'lxml')
Next, we search our soup for the two tables within the html tbody’s (tbodies? Can’t be…):
    all_tables = soup.findAll("tbody")
    team_table = all_tables[0]
    player_table = all_tables[1]
Great! You now have your data! (Um, yeah but they are still in the soup…) Yeah, it looks a bit strange…
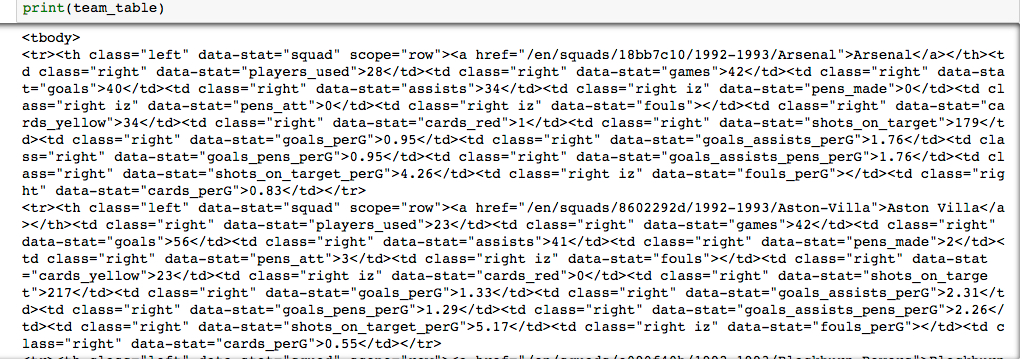
Staring at this html a bit, you will see that each row is given by the tr (table row) tag, and each column is given by the th (table heading) tag. To help, we can use the row scope to make sure we get the right thing, and the data-stat classifier for getting the correct column for the data.
Let’s parse that into a dictionary so we can save it in an easy format. First, setup an empty dictionary, which will eventually contain the features we are interested in as keys and our data as values in lists. These features must exactly match the data-stat classifiers in the html!
	pre_df_squad = dict()
    #Note: features does not contain squad name, it requires special treatment
    features_wanted_squad = {"players_used","games",...}
The parsing is done as a loop over the rows:
    rows_squad = team_table.find_all('tr')
    for row in rows_squad:
        if(row.find('th',{"scope":"row"}) != None):
            name =    row.find('th',{"data-stat":"squad"}).text.strip().encode().decode("utf-8")
            if 'squad' in pre_df_squad:
                pre_df_squad['squad'].append(name)
            else:
                pre_df_squad['squad'] = [name]
            for f in features_wanted_squad:
                cell = row.find("td",{"data-stat": f})
                a = cell.text.strip().encode()
                text=a.decode("utf-8")
                if f in pre_df_squad:
                    pre_df_squad[f].append(text)
                else:
                    pre_df_squad[f] = [text]
This code:
- makes a list of all rows (tr tags)
- loops over those rows to find each of the features we want (data-stat tag)
- strips some garbage out of the data so we are left simple text
- then saves the data to our dictionary by either:
- appending new value to the list within the dictionary for that feature
- adding a new key to the dictionary with the new value as a list
Special treatment was needed to get the “squad” feature for the team table, as sometimes it could appear before the specification of scope="row".
Finally, we save this to a dataframe and then dump it to a csv:
    df_squad = pd.DataFrame.from_dict(pre_df_squad)
    df_squad.to_csv(output_name)
Scraping the full history of EPL from 1992 to 2018 for both, offensive and keeper statistics, took ~5-10min. So, it is saved to the GitHub repo for subsequent analysis.